In part 1 of this series, we learned about creating Docker images using a Dockerfile, tagging our images and managing images. Next we took a look at running containers, publishing ports, and running containers in detached mode. We then learned about managing containers by starting, stopping and restarting them. We also looked at naming our containers so they are more easily identifiable.

In this post, we’ll focus on setting up our local development environment. First, we’ll take a look at running a database in a container and how we use volumes and networking to persist our data and allow our application to talk with the database. Then we’ll pull everything together into a compose file which will allow us to setup and run a local development environment with one command. Finally, we’ll take a look at connecting a debugger to our application running inside a container.
Local Database and Containers
Instead of downloading MongoDB, installing, configuring and then running the Mongo database as a service. We can use the Docker Official Image for MongoDB and run it in a container.
Before we run MongoDB in a container, we want to create a couple of volumes that Docker can manage to store our persistent data and configuration. I like to use the managed volumes feature that docker provides instead of using bind mounts. You can read all about volumes in our documentation.
Let’s create our volumes now. We’ll create one for the data and one for configuration of MongoDB.
$ docker volume create mongodb
$ docker volume create mongodb_config
Now we’ll create a network that our application and database will use to talk with each other. The network is called a user defined bridge network and gives us a nice DNS lookup service which we can use when creating our connection string.
docker network create mongodb
Now we can run MongoDB in a container and attach to the volumes and network we created above. Docker will pull the image from Hub and run it for you locally.
$ docker run -it --rm -d -v mongodb:/data/db \
-v mongodb_config:/data/configdb -p 27017:27017 \
--network mongodb \
--name mongodb \
mongo
Okay, now that we have a running mongodb, let’s update server.js to use a the MongoDB and not an in-memory data store.
const ronin = require( 'ronin-server' )
const mocks = require( 'ronin-mocks' )
const database = require( 'ronin-database' )
const server = ronin.server()
database.connect( process.env.CONNECTIONSTRING )
server.use( '/', mocks.server( server.Router(), false, false ) )
server.start()
We’ve add the ronin-database module and we updated the code to connect to the database and set the in-memory flag to false. We now need to rebuild our image so it contains our changes.
First let’s add the ronin-database module to our application using npm.
$ npm install ronin-database
Now we can build our image.
$ docker build --tag node-docker .
Now let’s run our container. But this time we’ll need to set the CONNECTIONSTRING environment variable so our application knows what connection string to use to access the database. We’ll do this right in the docker run command.
$ docker run \
-it --rm -d \
--network mongodb \
--name rest-server \
-p 8000:8000 \
-e CONNECTIONSTRING=mongodb://mongodb:27017/yoda_notes \
node-docker
Let’s test that our application is connected to the database and is able to add a note.
$ curl --request POST \
--url http://localhost:8000/notes \
--header 'content-type: application/json' \
--data '{
"name": "this is a note",
"text": "this is a note that I wanted to take while I was working on writing a blog post.",
"owner": "peter"
}'
You should receive the following json back from our service.
{"code":"success","payload":{"_id":"5efd0a1552cd422b59d4f994","name":"this is a note","text":"this is a note that I wanted to take while I was working on writing a blog post.","owner":"peter","createDate":"2020-07-01T22:11:33.256Z"}}
Using Compose to Develop locally
Awesome! We now have our MongoDB running inside a container and persisting it’s data to a Docker volume. We also were able to pass in the connection string using an environment variable.
But this can be a little bit time consuming and also difficult to remember all the environment variables, networks and volumes that need to be created and set up to run our application.
In this section, we’ll use a Compose file to configure everything we just did manually. We’ll also set up the Compose file to start the application in debug mode so that we can connect a debugger to the running node process.
Open your favorite IDE or text editor and create a new file named docker-compose.dev.yml. Copy and paste the below commands into that file.
version: '3.8'
services:
notes:
build:
context: .
ports:
- 8000:8000
- 9229:9229
environment:
- CONNECTIONSTRING=mongodb://mongo:27017/notes
volumes:
- ./:/code
command: npm run debug
mongo:
image: mongo:4.2.8
ports:
- 27017:27017
volumes:
- mongodb:/data/db
- mongodb_config:/data/configdb
volumes:
mongodb:
mongodb_config:
This compose file is super convenient because now we do not have to type all the parameters to pass to the docker run command. We can declaratively do that in the compose file.
We are exposing port 9229 so that we can attach a debugger. We are also mapping our local source code into the running container so that we can make changes in our text editor and have those changes picked up in the container.
One other really cool feature of using a compose file, is that we have service resolution automatically set up for us. So we are now able to use “mongo” in our connection string. The reason we can use “mongo” is because this is the name we used in the compose file to label our container running our MongoDB.
To be able to start our application in debug mode, we need to add a line to our package.json file to tell npm how to start our application in debug mode.
Open the package.json file and add the following line to the scripts section.
"debug": "nodemon --inspect=0.0.0.0:9229 server.js"
As you can see we are going to use nodemon. Nodemon will start our server in debug mode and also watch for files that have changed and restart our server. Let’s add nodemon to our package.json file.
$ npm install nodemon
Let’s first stop our running application and the mongodb container. Then we can start our application using compose and confirm that it is running properly.
$ docker stop rest-server mongodb
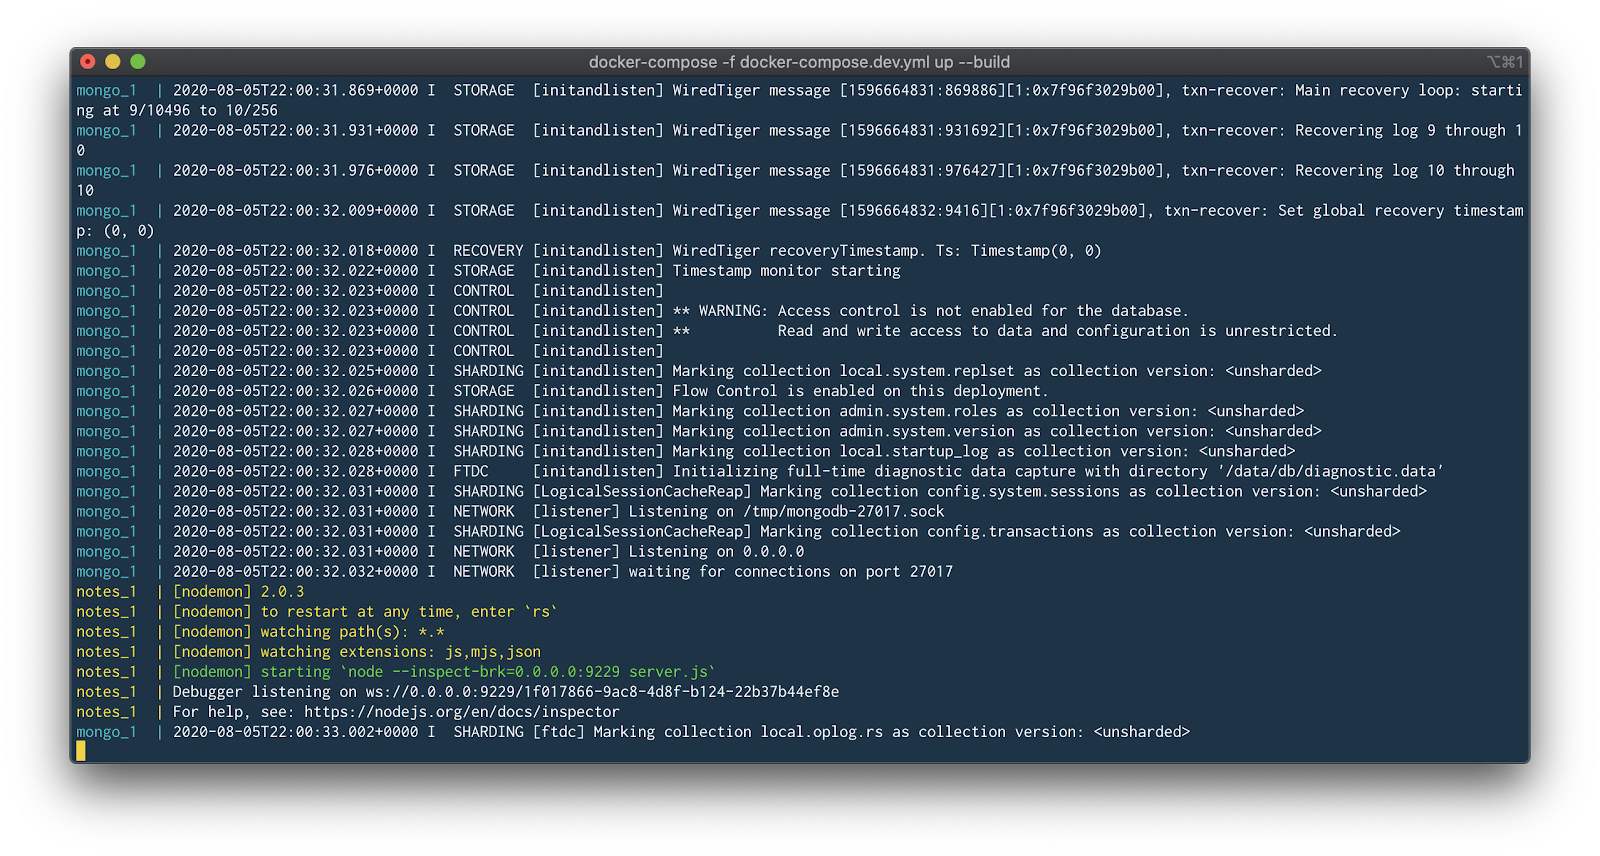
$ docker-compose -f docker-compose.dev.yml up --build
If you get the following error: ‘Error response from daemon: No such container:’ Don’t worry. That just means that you have already stopped the container or it wasn’t running in the first place.
You’ll notice that we pass the “–build” flag to the docker-compose command. This tells Docker to first compile our image and then start it.
If all goes will you should see something similar:

Now let’s test our API endpoint. Run the following curl command:
$ curl --request GET --url http://localhost:8000/notes
You should receive the following response:
{"code":"success","meta":{"total":0,"count":0},"payload":[]}
Connecting a Debugger
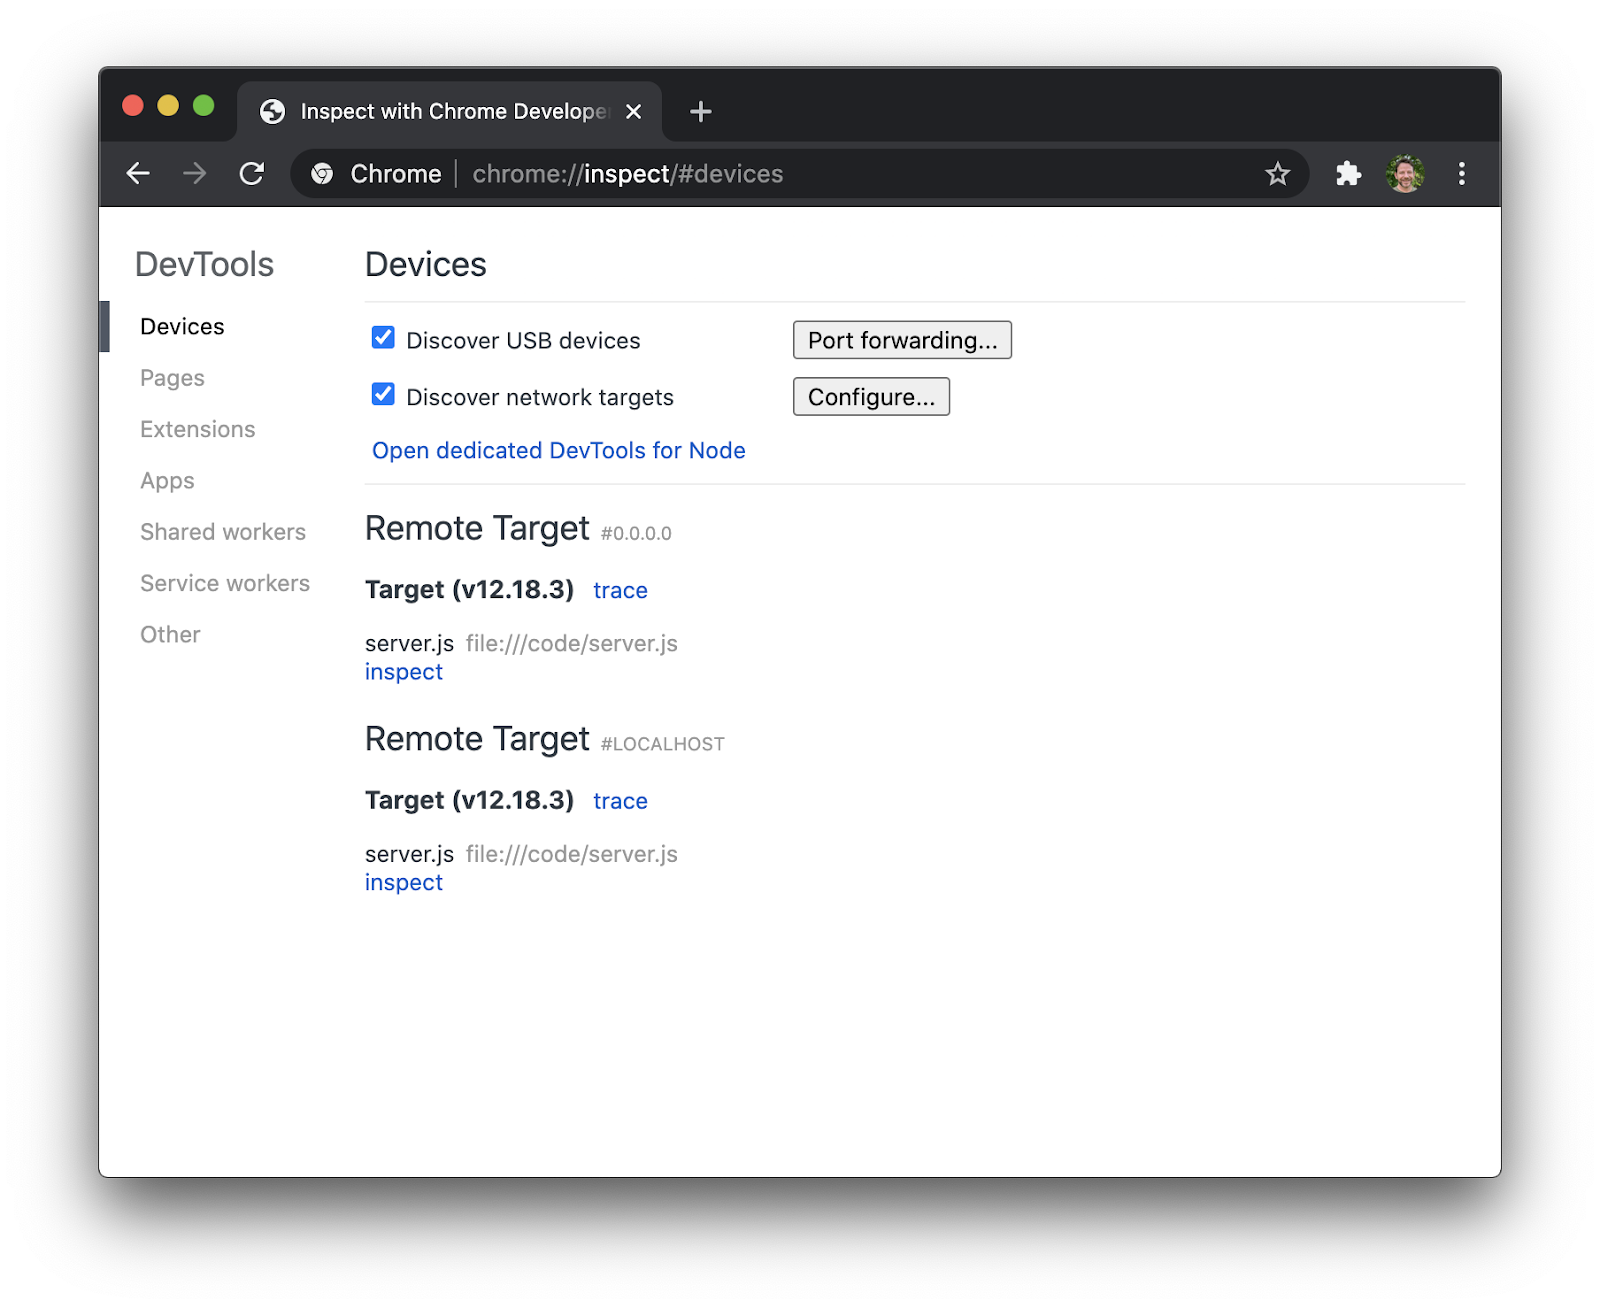
We’ll use the debugger that comes with the Chrome browser. Open Chrome on your machine and then type the following into the address bar.
about:inspect
The following screen will open.

Click the “Open dedicated DevTools for Node” link. This will open the DevTools window that is connected to the running node.js process inside our container.
Let’s change the source code and then set a breakpoint.
Add the following code to the server.js file on line 9 and save the file.
server.use( '/foo', (req, res) => {
return res.json({ "foo": "bar" })
})
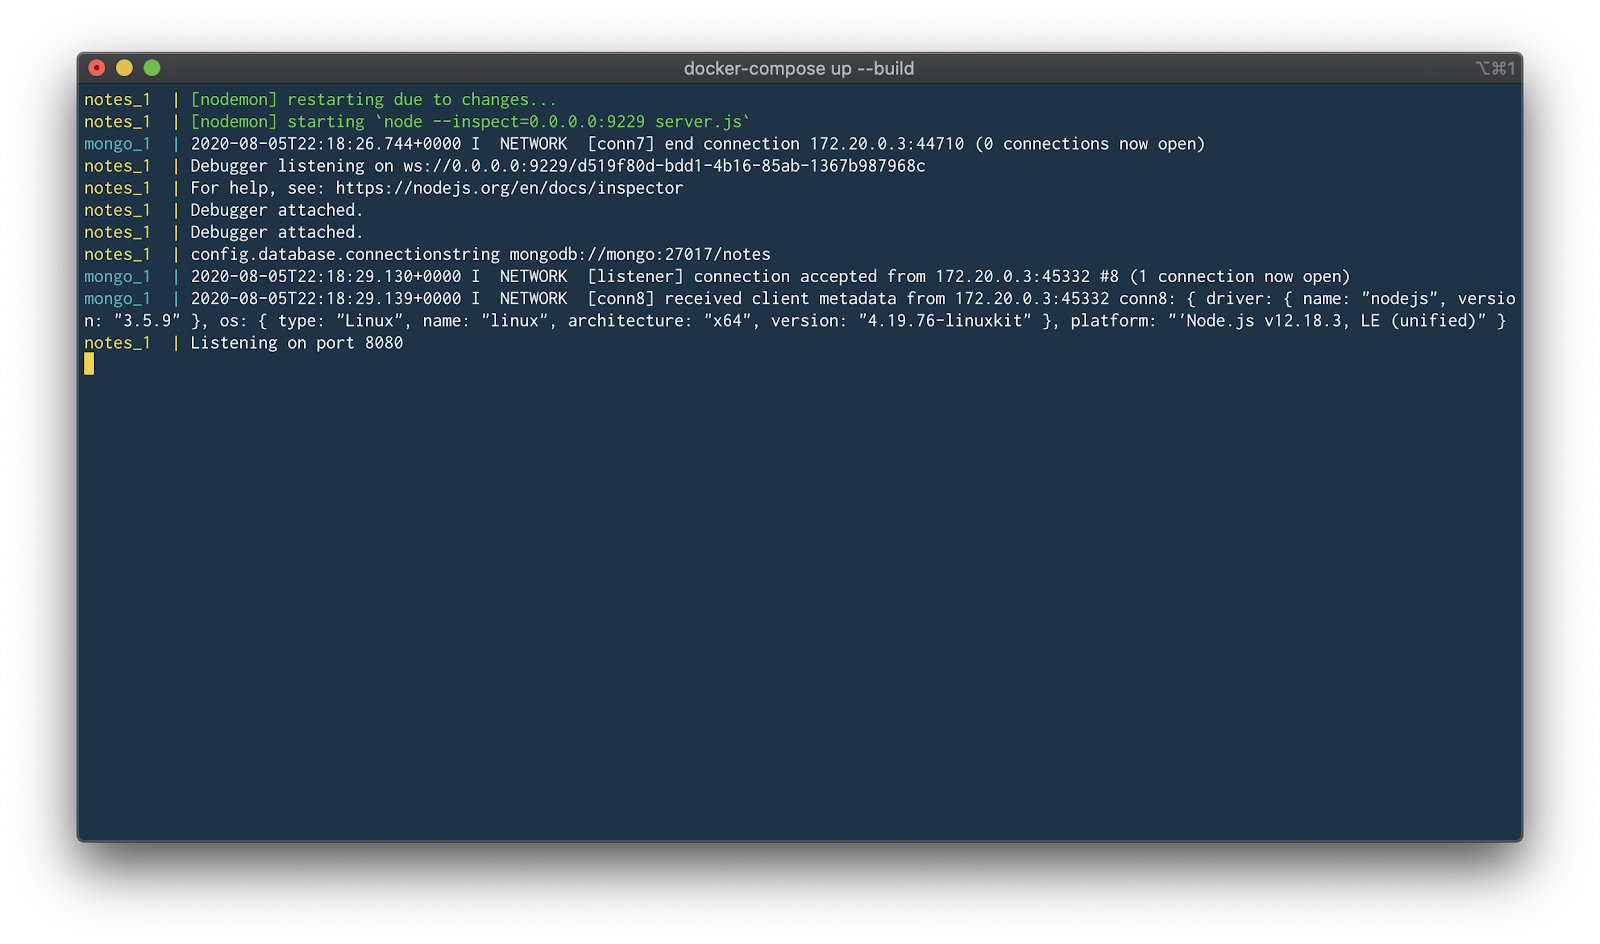
If you take a look at the terminal where our compose application is running, you’ll see that nodemon noticed the changes and reloaded our application.

Navigate back to the Chrome DevTools and set a breakpoint on line 10 and then run the following curl command to trigger the breakpoint.
$ curl --request GET --url http://localhost:8000/foo
BOOM You should have seen the code break on line 10 and now you are able to use the debugger just like you would normally. You can inspect and watch variables, set conditional breakpoints, view stack traces and a bunch of other stuff.
Conclusion
In this post, we ran MongoDB in a container, connected it to a couple of volumes and created a network so our application could talk with the database. Then we used Docker Compose to pull all this together into one file. Finally, we took a quick look at configuring our application to start in debug mode and connected to it using the Chrome debugger.
Learn more
- Dive into our Node.js language-specific guide
