This is a guest post from Docker Captain Elton Stoneman, a Docker alumni who is now a freelance consultant and trainer, helping organizations at all stages of their container journey. Elton is the author of the book Learn Docker in a Month of Lunches, and numerous Pluralsight video training courses – including Managing Apps on Kubernetes with Istio and Monitoring Containerized Application Health with Docker.
Istio is a service mesh – a software component that runs in containers alongside your application containers and takes control of the network traffic between components. It’s a powerful architecture that lets you manage the communication between components independently of the components themselves. That’s useful because it simplifies the code and configuration in your app, removing all network-level infrastructure concerns like routing, load-balancing, authorization and monitoring – which all become centrally managed in Istio.
There’s a lot of good material for digging into Istio. My fellow Docker Captain Lee Calcote is the co-author of Istio: Up and Running, and I’ve just published my own Pluralsight course Managing Apps on Kubernetes with Istio. But it can be a difficult technology to get started with because you really need a solid background in Kubernetes before you get too far. In this post, I’ll try and keep it simple. I’ll focus on three scenarios that Istio enables, and all you need to follow along is Docker Desktop.
Setup
Docker Desktop gives you a full Kubernetes environment on your laptop. Just install the Mac or Windows version – be sure to switch to Linux containers if you’re using Windows – then open the settings from the Docker whale icon, and select Enable Kubernetes in the Kubernetes section. You’ll also need to increase the amount of memory Docker can use, because Istio and the demo app use a fair bit – in the Resources section increase the memory slider to at least 6GB.
Now grab the sample code for this blog post, which is in my GitHub repo:
git clone https://github.com/sixeyed/istio-samples.git
cd istio-samples
The repo has a set of Kubernetes manifests that will deploy Istio and the demo app, which is a simple bookstore website (this is the Istio team’s demo app, but I use it in different ways so be sure to use my repo to follow along). Deploy everything using the Kubernetes control tool kubectl, which is installed as part of Docker Desktop:
kubectl apply -f ./setup/You’ll see dozens of lines of output as Kubernetes creates all the Istio components along with the demo app – which will all be running in Docker containers. It will take a few minutes for all the images to download from Docker Hub, and you can check the status using kubectl:
# Istio - will have “1/1” in the “READY” column when fully running:
kubectl get deploy -n istio-system
# demo app - will have “2/2” in the “READY” column when fully running:
kubectl get pods
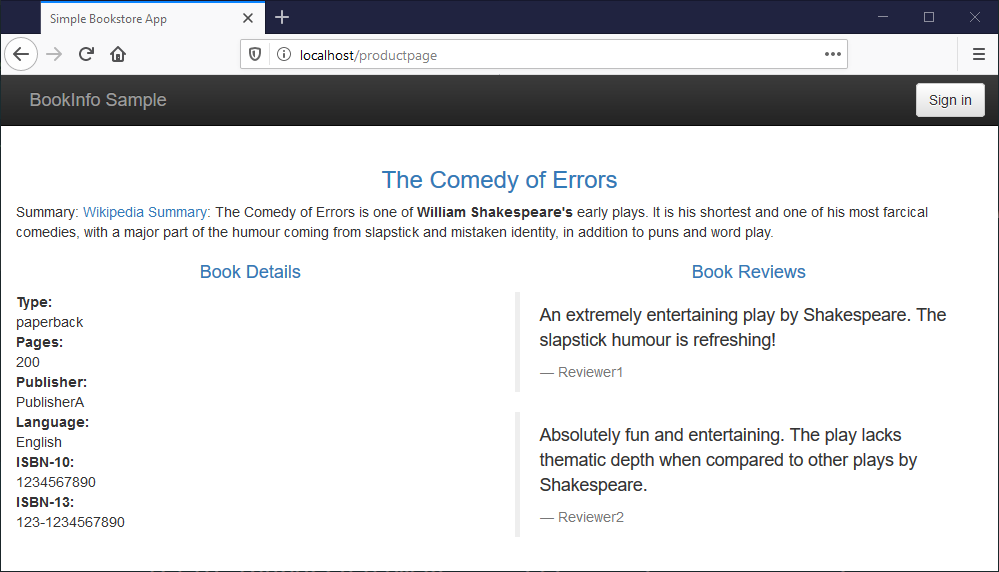
When all the bits are ready, browse to http://localhost/productpage and you’ll see this very simple demo app:

And you’re good to go. If you’re happy working with Kubernetes YAML files you can look at the deployment spec for the demo app, and you’ll see it’s all standard Kubernetes resources – services, service accounts and deployments. Istio is managing the communication for the app, but we haven’t deployed any Istio configurations, so it isn’t doing much yet.
The demo application is a distributed app. The homepage runs in one container and it consumes data from REST APIs running in other containers. The book details and book reviews you see on the page are fetched from other containers. Istio is managing the network traffic between those components, and it’s also managing the external traffic which comes into Kubernetes and on to the homepage.
We’ll use this demo app to explore the main features of Istio: traffic management, security and observability.
Managing Traffic – Canary Deployments with Istio
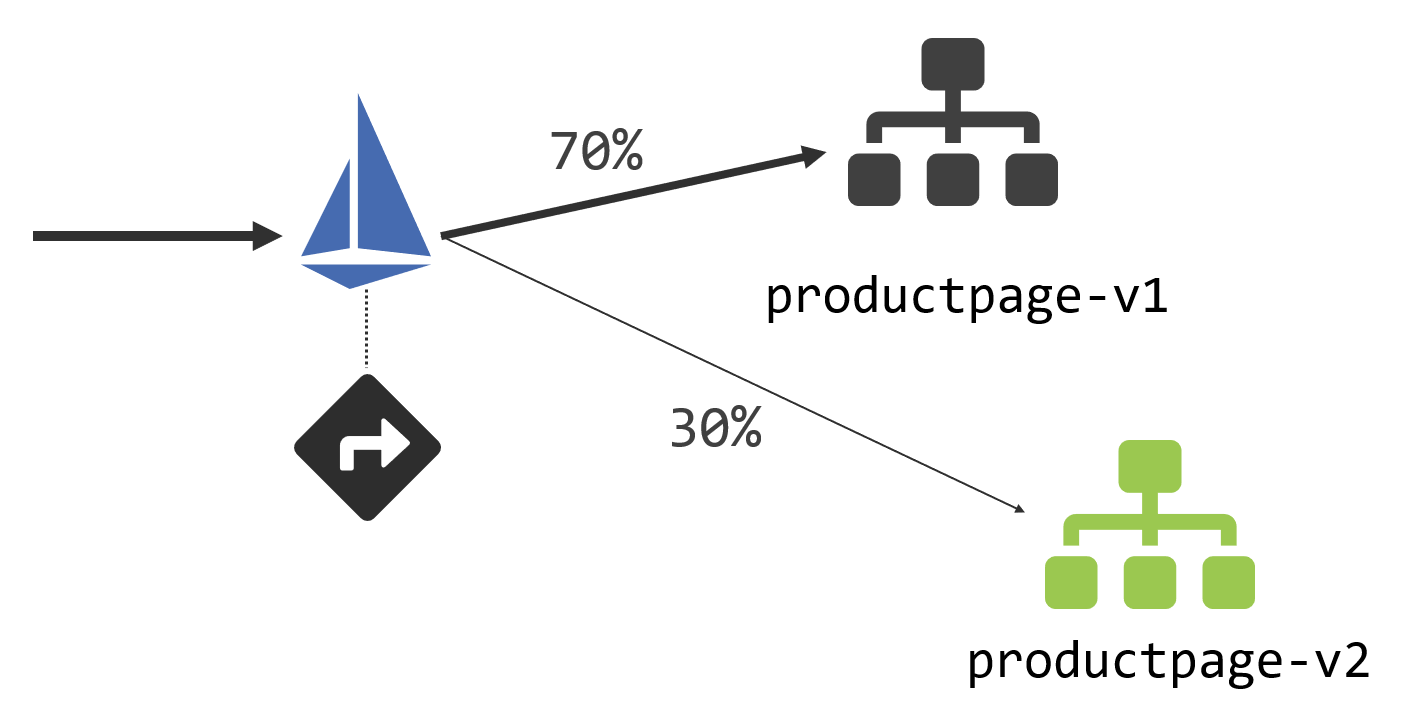
The homepage is kinda boring, so let’s liven it up with a new release. We want to do a staged release so we can check out how the update gets received, and Istio supports both blue-green and canary deployments. Canary deployments are generally more useful and that’s what we’ll use. We’ll have two versions of the home page running, and Istio will send a proportion of the traffic to version 1 and the remainder to version 2:

We’re using Istio for service discovery and routing here: all incoming traffic comes into Istio and we’re going to set rules for how it forwards that traffic to the product page component. We do that by deploying a VirtualService, which is a custom Istio resource. That contains this routing rule for HTTP traffic:
gateways:
    - bookinfo-gateway
  http:
    - route:
        - destination:
            host: productpage
            subset: v1
            port:
              number: 9080
          weight: 70
        - destination:
            host: productpage
            subset: v2
            port:
              number: 9080
          weight: 30
There are a few moving pieces here:
- The
gatewayis the Istio component which receives external traffic. The bookinfo-gateway object is configured to listen to all HTTP traffic, but gateways can be restricted to specific ports and host names; - The
destinationis the actual target where traffic will be routed (which can be different from the requested domain name). In this case, there are two subsets, v1 which will receive 70% of traffic and v2 which receives 30%; - Those
subsetsare defined in a DestinationRule object, which uses Kubernetes labels to identify pods within a service. In this case the v1 subset finds pods with the label version=v1, and the v2 subset finds pods with the label version=v2.
Sounds complicated, but all it’s really doing is defining the rules to shift traffic between different pods. Those definitions come in Kubernetes manifest YAML files, which you deploy in the same way as your applications. So we can do our canary deployment of version 2 with a single command – this creates the new v2 pod, together with the Istio routing rules:
# deploy:
kubectl apply -f ./canary-deployment

# check the deployment - it’s good when all pods show “2/2” in “READY”:
kubectl get pods
Now if you refresh the bookstore demo app a few times, you’ll see that most of the responses are the same boring v1 page, but a lucky few times you’ll see the v2 page which is the result of much user experience testing:

As the positive feedback rolls in you can increase the traffic to v2 just by altering the weightings in the VirtualService definition and redeploying. Both versions of your app are running throughout the canary stage, so when you shift traffic you’re sending it to components that are already up and ready to handle traffic, so there won’t be additional latency from new pods starting up.
Canary deployments are just one aspect of traffic management which Istio makes simple. You can do much more, including adding add fault tolerance with retries and circuit breakers, all with Istio components and without any changes to your apps.
Securing Traffic – Authentication and Authorization with mTLS
Istio handles all the network traffic between your components transparently, without the components themselves knowing that it’s interfering. It does this by running all the application container traffic through a network proxy, which applies Istio’s rules. We’ve seen how you can use that for traffic management, and it works for security too.
If you need encryption in transit between app components, and you want to enforce access rules so only certain consumers can call services, Istio can do that for you too. You can keep your application code and config simple, use basic unauthenticated HTTP and then apply security at the network level.
Authentication and authorization are security features of Istio which are much easier to use than they are to explain. Here’s the diagram of how the pieces fit together:
Here the product page component on the left is consuming a REST API from the reviews component on the right. Those components run in Kubernetes pods, and you can see each pod has one Docker container for the application and a second Docker container running the Istio proxy, which handles the network traffic for the app.
This setup uses mutual-TLS for encrypting the HTTP traffic and authenticating and authorizing the caller:
- The authentication Policy object applied to the service requires mutual TLS, which means the service proxy listens on port 443 for HTTPS traffic, even though the service itself is only configured to listen on port 80 for HTTP traffic;
- The AuthorizationPolicy object applied to the service specifies which other components are allowed access. In this case, everything is denied access, except the product page component which is allowed HTTP GET access;
- The DestinationRule object is configured for mutual-TLS, which means the proxy for the product page component will upgrade HTTP calls to HTTPS, so when the app calls the reviews component it will be a mutual-TLS conversation.
Mutual-TLS means the client presents a certificate to identify itself, as well as the service presenting a certificate for encryption (only the server cert is standard HTTPS behavior). Istio can generate and manage all those certs, which removes a huge burden from normal mTLS deployments.
There’s a lot to take in there, but the deployment and management of all that is super simple, it’s just the same kubectl process:
kubectl apply -f ./service-authorization/
Istio uses the Kubernetes Service Account for identification, and you’ll see when you try the app that nothing’s changed, it all works as before. The difference is that no other components running in the cluster can access the reviews component now, the API is locked down so only the product page can consume it.
You can verify that by connecting to another container – the details component is running in the same cluster. Try to consume the reviews API from the details container:
docker container exec -it $(docker container ls --filter name=k8s_details --format '{{ .ID}}') sh

curl http://reviews:9080/1
You’ll see an error – RBAC: access denied, which is Istio enforcing the authorization policy. This is powerful stuff, especially having Istio manage the certs for you. It generates certs with a short lifespan, so even if they do get compromised they’re not usable for long. All this without complicating your app code or dealing with self-signed certs.
Observability – Visualising the Service Mesh with Kiali
All network traffic runs through Istio, which means it can monitor and record all the communication. Istio uses a pluggable architecture for storing telemetry, which has support for standard systems like Prometheus and Elasticsearch.
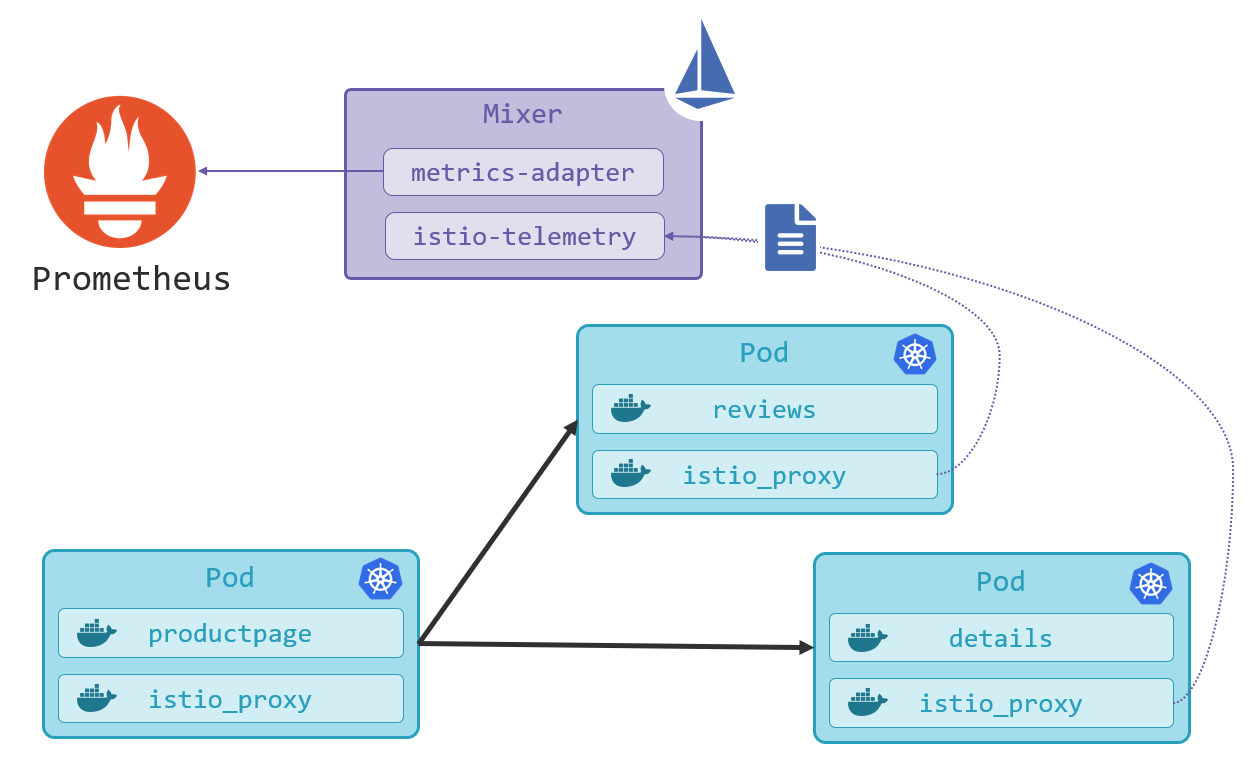
Collecting and storing telemetry for every network call can be expensive, so this is all configurable. The deployment of Istio we’re using is the demo configuration, which has telemetry configured so we can try it out. Telemetry data is sent from the service proxies to the Istio component called Mixer, which can send it out to different back-end stores, in this case, Prometheus:

(This diagram is a simplification – Prometheus actually pulls the data from Istio, and you can use a single Prometheus instance to collect metrics from Istio and your applications).
The data in Prometheus includes response codes and durations, and Istio comes with a bunch of Grafana dashboards you can use to drill down into the metrics. And it also has support for a great tool called Kiali, which gives you a very useful visualization of all your services and the network traffic between them.
Kiali is already running in the demo deployment, but it’s not published by default. You can gain access by deploying a Gateway and a VirtualService:
kubectl apply -f ./visualization-kiali/
Now refresh the app a few times at http://localhost/productpage and then check out the service mesh visualization in Kiali at http://localhost:15029. Log in with the username admin and password admin, then browse to the Graph view and you’ll see the live traffic for the bookstore app:
I’ve turned on “requests percentage” for the labels here, and I can see the traffic split between my product page versions is 67% to 34%, which is pretty close to my 70-30 weighting (the more traffic you have, the closer you’ll get to the specified weightings).
Kiali is just one of the observability tools Istio supports. The demo deployment also runs Grafana with multiple dashboards and Jaeger for distributed tracing – which is a very powerful tool for diagnosing issues with latency in distributed applications. All the data to power those visualizations is collected automatically by Istio.
Wrap-Up
A service mesh makes the communication layer for your application into a separate entity, which you can control centrally and independently from the app itself. Istio is the most fully-featured service mesh available now, although there is also Linkerd (which tends to have better baseline performance), and the Service Mesh Interface project (which aims to standardise mesh features).
Using a service mesh comes with a cost – there are runtime costs for hosting additional compute for the proxies and organizational costs for getting teams skilled in Istio. But the scenarios it enables will outweigh the cost for a lot of people, and you can very quickly test if Istio is for you, using it with your own apps in Docker Desktop.


