Update: Docker Desktop 4.33 includes the GA release of Docker Debug. Developers can spend as much as 60% of their time debugging their applications, with much of that time taken up by sorting and configuring tools and setup instead of debugging. Docker Debug provides a language-independent, integrated toolbox for debugging local and remote containerized apps — even when the container fails to launch — enabling developers to find and solve problems faster. Docker Debug is available in Pro, Teams, or Business subscriptions. Read the documentation to learn more and get started with Docker Debug today.
While containers help developers rapidly build and run cross-platform applications, creating error-free apps remains a constant challenge. And while it’s not always obvious how container errors occur, this mystery is even harder for newer developers to unravel. Figuring out how to debug Docker containers can seem daunting.
In this Community All-Hands session, Ákos Takács demonstrated how to solve many of these pesky problems and gain the superpower of fixing containers.
Each issue can impact your image builds and final applications. Some bugs may not trigger clear error messages. To further complicate things, source-code inspection isn’t always helpful.
But, common container issues don’t have to be your kryptonite! We’ll share Ákos’ favorite tips and show you how to conquer these development challenges.
In this tutorial:
- Finding and fixing common container mistakes
Finding and fixing common container mistakes
Everyone is prone to the occasional silly mistake. You code when you’re tired, suffer from the occasional keyboard slip, or sometimes fail to copy text correctly between steps. These missteps can carry forward from one command to the next. And because easy-to-miss things like spelling errors or character omissions can fly under the radar, you’re left doing plenty of digging to solve basic problems. Nobody wants that, so what tools are at your disposal?
Using the CLI for extra container visibility
Say we have an image downloaded from Docker Hub — any image at all — and use some variation of the docker run command to run it. The resulting container will be running the default command. If you want to surface that command, entering docker container ls --all will grab a list of containers with their respective commands.
Users often copy these commands and reuse them within other longer CLI commands. As you’d expect, it’s incredibly easy to highlight incorrectly, copy an incomplete phrase, and run a faulty command that uses it.
While spinning up a new container, you’ll hit a snag. The runtime in this instance will fail since Docker cannot find the executable. It’s not located in the PATH, which indicates a problem:

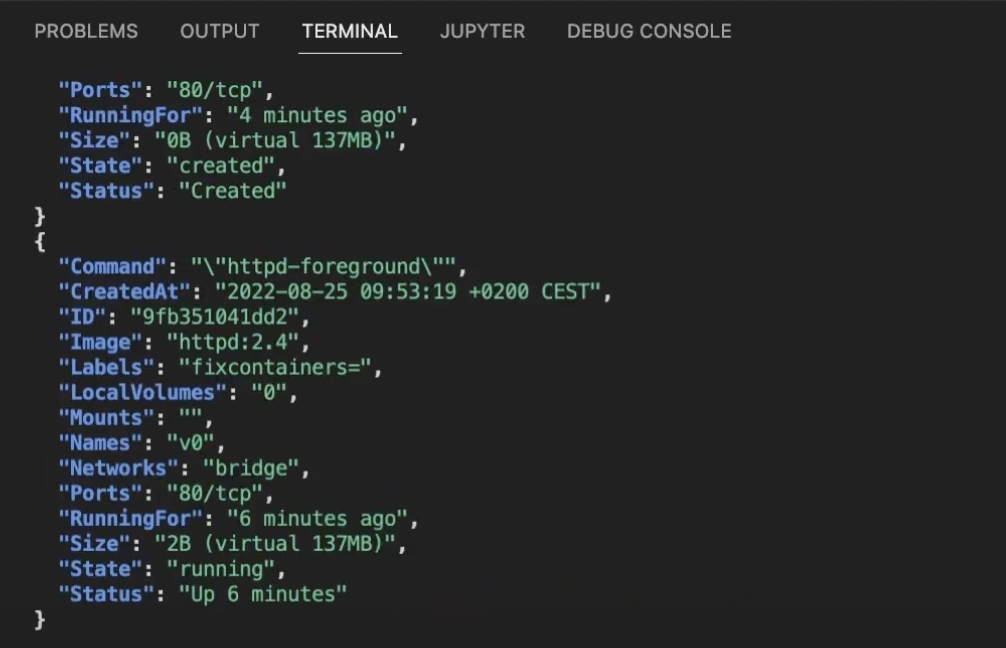
Running the docker container ls --all command also offers some hints. Note the httpd-foregroun container command paired with its created (but not running) container. Conversely, the v0 container that’s running successfully leverages a valid, complete command:

How do we investigate further? Use the docker run --rm -it --name MYCONTAINER [IMAGE] bash command to open an interactive terminal within your container. Take the container’s default command and attempt to run it again. A “command not found” error message will appear.
This is much more succinct and shows that you’ve likely entered the wrong command — in this case by forgetting a character. While Ákos’ example uses httpd, it’s applicable to almost any container image.
Change your CLI output formatting for visibility and readability
Container commands are clipped once they exceed a certain length in the terminal output. That prevents you from inspecting the command in its entirety.
Luckily, Ákos showed how the --format ‘{{ json . }}’ | jq -C flag can improve how your terminal displays outputs. Instead of cutting off portions of text, here’s how your docker container ls --all result will look:

You can read and compare any parameters in full. Nothing is hidden. If you don’t have jq installed, you could instead enter the following command to display outputs similarly minus syntax highlighting. This beats the default tabular layout for troubleshooting:
1 | docker container ls --all --format ‘{{ json . }}’ | python3 -m json.tool --json-lines |
Lastly, why not just expand the original table view while only displaying relevant information? Run the following command with the --no-trunc flag to expand those table rows and completely reveal each cell’s contents:
1 | docker container ls --all --format ‘table {{ .Names }}/t{{ .Status }}/t{{ .Command }}’ --no-trunc |
These examples highlight the importance of visibility and transparency in troubleshooting. When you can uncover and easily digest the information you need, making corrections is much easier.
Remember to leverage your logs
By following best practices, any active application running within a Docker container will produce log outputs. While you might view logging as a problem-catching mechanism, many running containers don’t experience issues.
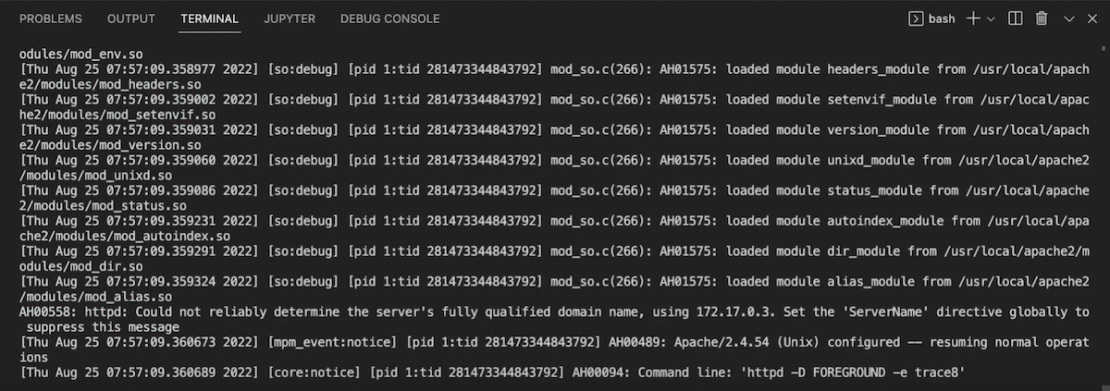
Ákos believes it’s important to understand how normal log entries look. As a result, identifying abnormal log entries becomes that much easier. The docker logs command enables this:

The process of tuning your logs differs between tools and languages. For example, Ákos drew from methods involving httpd — like trace for detailed trace-level messages or LogLevel for filtering error messages — but these practices are widely applicable. You’ll probably want to zero in on startup and runtime errors to diagnose most issues.
Log handling is configurable. Here are some common commands to help you drill down into container issues (and reduce noise):
Grab your container’s last 100 logs:
docker logs --tail 100 [container ID]
Grab all logs for a specific container:
docker logs [container ID]
View all active processes within a running container, should its logs be inaccessible:
docker top [container ID]
Log inspection enables easier remediation. Alongside Ákos, we agree that you should confirm any container changes or fixes after making them. This means you’ve taken the right steps and can move ahead.
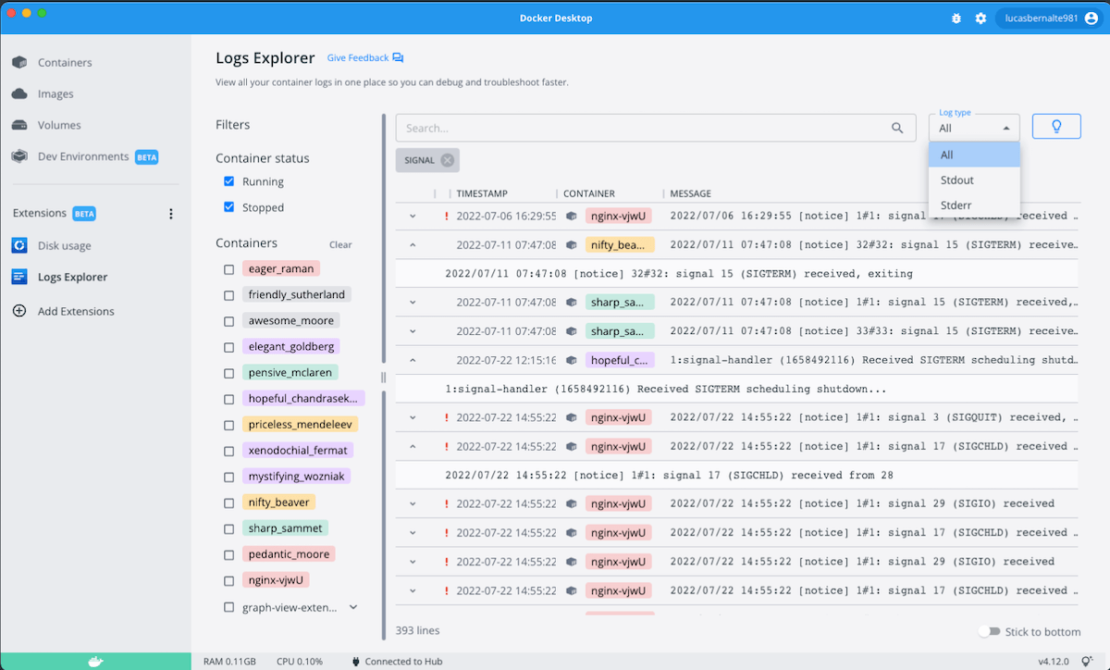
Want to view all your logs together within Docker Desktop? Download our Logs Explorer extension, which lets you browse through your logs using filters and advanced search capabilities. You can even view new logs as they populate.

Tackle issues with ENTRYPOINT
When running applications, you’ll need to run executable files within your container. The ENTRYPOINT portion of your Dockerfile sets the main command within a container and basically assigns it a task. These ENTRYPOINT instructions rely on executable files being in the container.
In Ákos’ example, he tackles a scenario where improper permissions can prevent Docker from successfully mounting and running an entrypoint.sh executable. You can copy his approach by doing the following:
- Use the
ls -l $PWD/examples/v6/entrypoint.shcommand to view your file’s permissions, which may be inadequate. - Confirm that permissions are incorrect.
- Run a
chmod 774command to let this file read, write, and execute for all users. - Use
docker runto spin up a containerv7from the originalentrypoint, which may work briefly but soon stop running. - Inspect the
entrypoint.shfile to confirm our desired command exists.
We can confirm this again by entering docker container inspect v7-exiting to view our container definition and parameters. While the Entrypoint is specified, its Cmd definition is null. That’s what’s causing the issue:

Why does this happen? Many don’t know that by setting --entrypoint, any image with a default command will empty that command automatically. You’ll need to redefine your command for your container to work properly. Here’s how that CLI command might look:
1 | docker run -d -v $PWD/examples/v7/entrypoint.sh:/entrypoint.sh --entrypoint /entrypoint.sh --name v7-running httpd:2.4 httpd-foreground |
This works for any container image but we’re just drawing from an earlier example. If you run this and list your containers again, v7 will be active. Confirm within your logs that everything looks good.
Access and inspect container content
Carefully managing files and system resources is critical during local development. That’s doubly true while working with multiple images, containers, or resource constraints. There are scenarios where your containers bloat as their contents accumulate over time.
Keeping your files tidy is one thing. However, you may also want to copy your files from your container and move them into a temporary folder — using the docker cp command with a specified directory. Using a variation of ls -la ./var/v8, borrowing from Ákos’ example, then produces a list containing every file.
This is great for visibility and confirming your container’s contents. And we can diagnose any issues one step further with docker container diff v8 to view which files have been changed, appended, or even deleted. If you’re experiencing strange container behavior, digging into these files might be useful.
Note: You can also leverage our Resource Usage extension to monitor disk space consumption, network activity, CPU usage, and memory usage in real time!
Dive deeply into files and folders
Close inspection is where hexdump comes in handy. The hexdump function converts your file into hexadecimal code, which is much more readable than binary. Ákos used the following commands:
1 2 | docker cp v8:/usr/local/apache2/bin/httpd ./var/v8-httpd``hexdump -C -n 100 ./var/v8-httpd |
You can adjust this -n number to read additional or fewer initial bytes. If your file contains text, this content will stand out and reveal the file’s main purpose. But, say you want to access a folder. While changing your directory and running docker container inspect … is standard, this method doesn’t work for Docker Desktop users. Since Desktop runs things in a VM, the host cannot access the folders within.
Ákos showcased CTO Justin Cormack’s own nsenter1 image on GitHub, which lets us tap into those containers running with Docker Desktop environments. Docker Captain Bret Fisher has since expanded upon nsenter1’s documentation while adding useful commands. With these pieces in place, run the following command:
1 | docker run --rm --privileged --pid=host alpine:3.16.2 nsenter -t 1 -m -u -i -n -p -- sh -c “ cd \”$(docker container inspect v8 --format ‘{{ .GraphDriver.Data.UpperDir }}’}\” \&& find .” |
This command’s output mirrors that from our earlier docker container diff command. You can also run a hexdump using that same image above, which gives you the same troubleshooting abilities regardless of your environment. You can also inspect your entrypoint.sh to make important changes.
Solve Docker Build errors
While Docker BuildKit is quick and resilient, you can encounter errors that prevent image build completion. To learn why, run the following command to view each sequential build stage:
1 | docker build $PWD/[MY SOURCE] --tag “MY TAG” --progress plain |
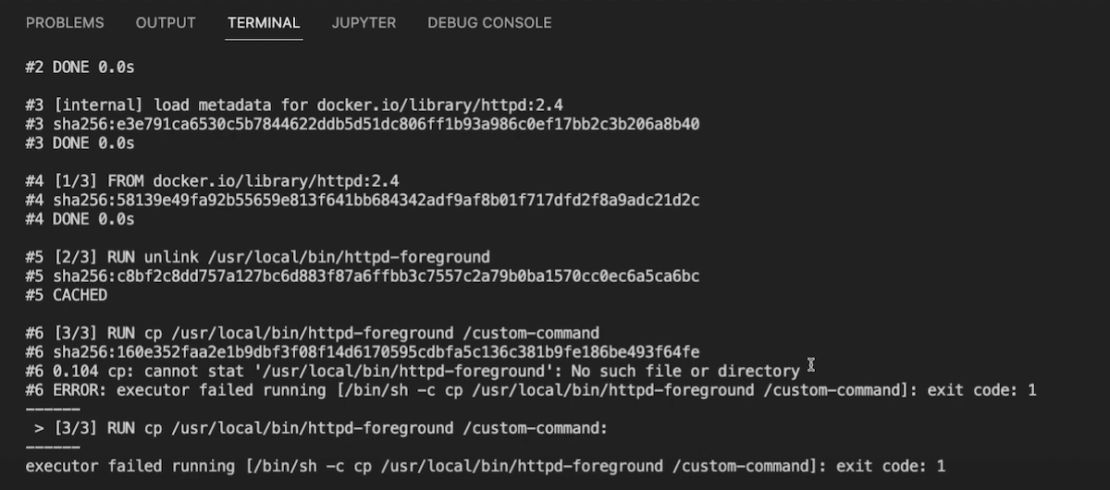
BuildKit will provide readable context for each step and display any errors that occur:

If you see a missing file or directory error like the one above, don’t worry! You can use the cat $PWD/[MY SOURCE]/[MY DOCKERFILE] command to view the contents of your Dockerfile. Not only can you see where you misstepped more clearly, but you can also add a new instruction before the failing command to list your folder’s contents.
Maybe those contents need updating. Maybe your folder is empty! In that case, you need to update everything so docker build has something to leverage.
Next, run the build command again with the --no-cache flag added. This flag tells Docker to cleanly build from scratch each time without relying on caching:

You can progressively build updated versions of your Dockerfile and test those changes, given the cascading nature of instructions. Writing new instructions after the last working instruction — or making changes earlier on in your file — can eliminate those pesky build issues. Mechanisms like unlink or cp are helpful. The first behaves like rm while accepting only one argument, while cp copies critical files and folders into your image from a source.
Solve Docker Compose errors
We use Docker Compose to spin up multiple services simultaneously using the docker compose --project-directory $PWD/[MY SOURCE] up -d command.
However, one or more of those containers might unexpectedly exit. By running docker compose --project-directory $PWD/[MY SOURCE] ps to list out our services, you can see which containers are running or exited.
To pinpoint the problem, you’d usually grab logs via the docker compose logs command. You won’t need to specify a project directory in most cases. However, your container produces no logs since it isn’t running.
Next, run the cat $PWD/[MY SOURCE]/docker-compose.yml command to view your Docker Compose file’s contents. It’s likely that your services definitions need fixing, so digging line by line within the CLI is helpful. Enter the following command to make this output even clearer:
1 | docker compose --project-directory $PWD/[MY SOURCE] config |
Your container exits when the commands contained within are invalid — just like we saw earlier. You’ll be able to see if you’ve entered a command incorrectly or if that command is empty. From there, you can update your Compose file and re-run docker compose --project-directory $PWD/[MY SOURCE] up -d. You can now confirm that everything is working by listing your services again. Your terminal will also output logs!
Optional: Make direct file edits within running containers
Finally, it’s possible (and tempting) to directly edit your files within your container. This is viable while testing new changes and inspecting your containers. However, it’s usually considered best practice to create a new image and container instead.
If you want to make edits within running containers, an editor like VS Code allows this, while IntelliJ doesn’t by comparison. Install the Docker extension for VS Code. You can then browse through your containers in the left sidebar, expand your collection of resources, and directly access important files. For example, web developers can directly edit their index.html files to change how user content is structured.
Investigate less and develop more
Overall, the process of fixing a container, on the surface, may seem daunting to newer Docker users. The methods we’ve highlighted above can dramatically reduce that troubleshooting complexity — saving you time and effort. You can spend less time investigating issues and more time creating the applications users love. And we think those skills are pretty heroic.
For more information, you can view Ákos Takács’ full presentation on YouTube to carefully follow each step. Want to dive deeper? Check out these additional resources to become a Docker expert:
- Learn how to view logs for a container or service
- View our Docker Run reference documentation
- Learn about best practices for writing Dockerfiles
