DevSecOps involves the integration of security throughout the entire software development and delivery lifecycle, representing a cultural shift where security is a collective responsibility for everyone building software. By embedding security at every stage, organizations can identify and resolve security issues earlier in the development process rather than during or after deployment.
Organizations adopting DevSecOps often ask, “Are we making progress?” To answer this, it’s crucial to implement metrics that provide clear insights into how an organization’s security posture evolves over time. Such metrics allow teams to track progress, pinpoint areas for improvement, and make informed decisions to drive continuous improvement in their security practices. By measuring the changing patterns in key indicators, organizations can better understand the impact of DevSecOps and make data-driven adjustments to strengthen their security efforts.
Organizations commonly have many DevSecOps metrics that they can draw from. In this blog post, we explore two foundational metrics for assessing DevSecOps success.

Key DevSecOps metrics
1. Number of security vulnerabilities over time
Vulnerability analysis is a foundational practice for any organization embarking on a software security journey. This metric tracks the volume of security vulnerabilities identified in a system or software project over time. It helps organizations spot trends in vulnerability detection and remediation, signaling how promptly security gaps are being remediated or mitigated. It can also be an indicator of the effectiveness of an org’s vulnerability management initiatives and their adoption, both of which are crucial to reducing the risk of cyberattacks and data breaches.
2. Compliance with security policies
Many industries are subject to cybersecurity frameworks and regulations that require organizations to maintain specific security standards. Policies provide a way for organizations to codify the rules for producing and using software artifacts. By tracking policy compliance over time, organizations can verify consistent adherence to established security requirements and best practices, promoting a unified approach to software development.
The above metrics are a good starting point for most organizations looking to measure their transformation from DevSecOps activities. The next step — once these metrics are implemented — is to invest in an observability system that enables relevant stakeholders, such as security engineering, to easily consume the data.
DevSecOps insights with Docker Scout
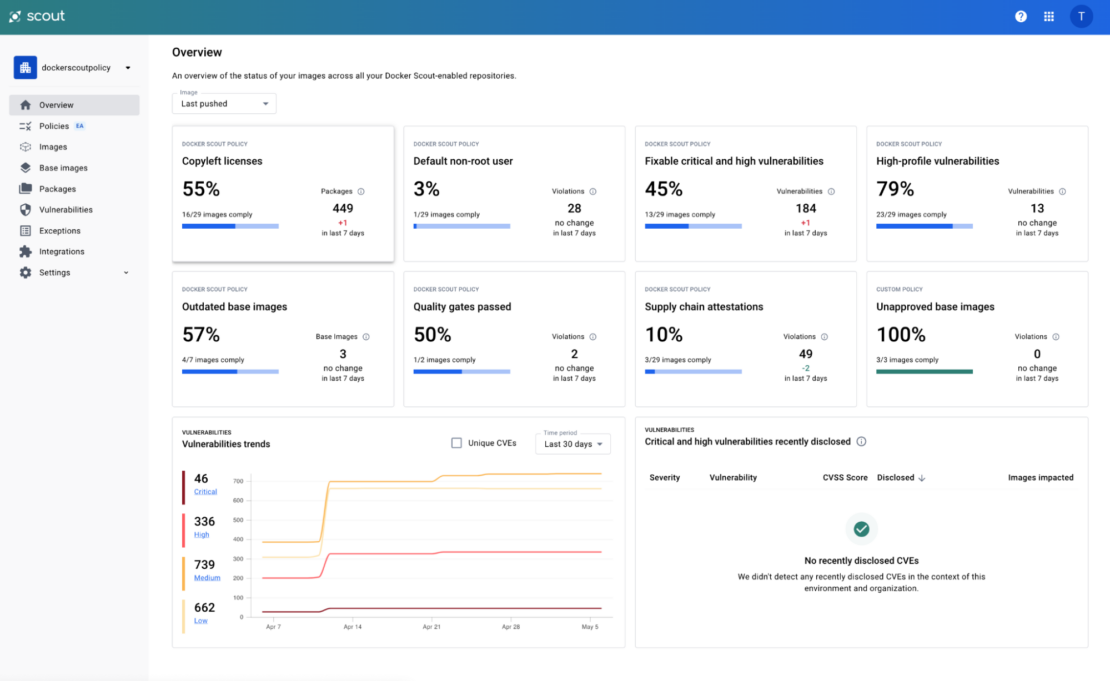
Organizations interested in evaluating their container images against these metrics can get started in a few simple steps with Docker Scout. The Docker Scout web interface provides a comprehensive dashboard for CISOs, security teams, and software developers, offering an overview of vulnerability trends and policy compliance status (Figure 1). The web interface is a one-stop shop where users can drill down into specific images for deeper investigations and customize out-of-the-box policies to meet their specific needs.

Furthermore, the Docker Scout metrics exporter is a powerful addition to the Docker Scout ecosystem to bring vulnerability and policy compliance metrics into existing monitoring systems. This HTTP endpoint enables users to configure Prometheus-compatible tools to scrape Docker Scout data, allowing organizations to integrate with popular observability tools like Grafana and Datadog to achieve centralized security observability.
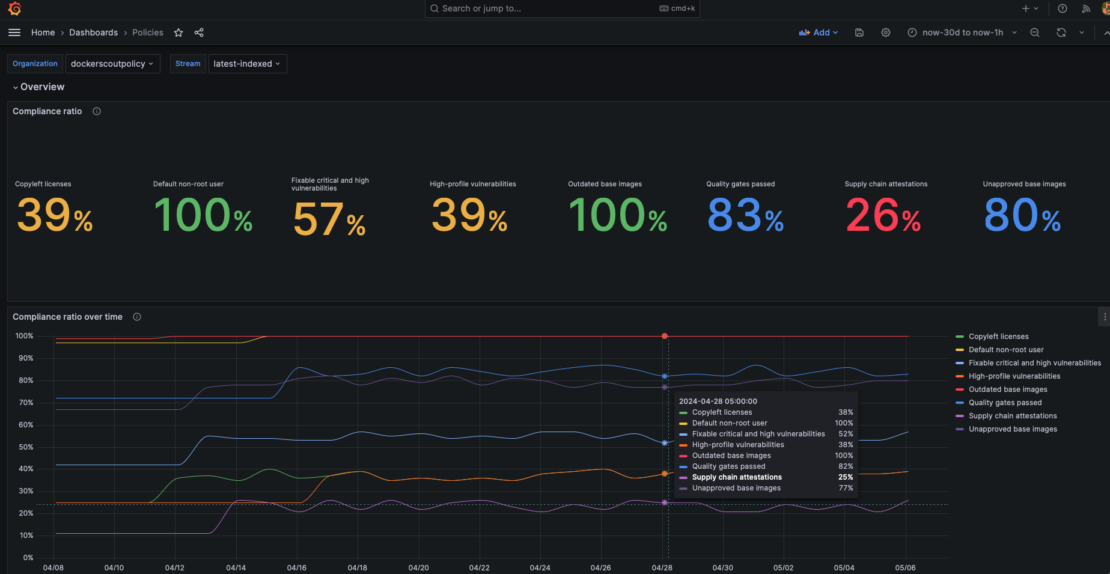
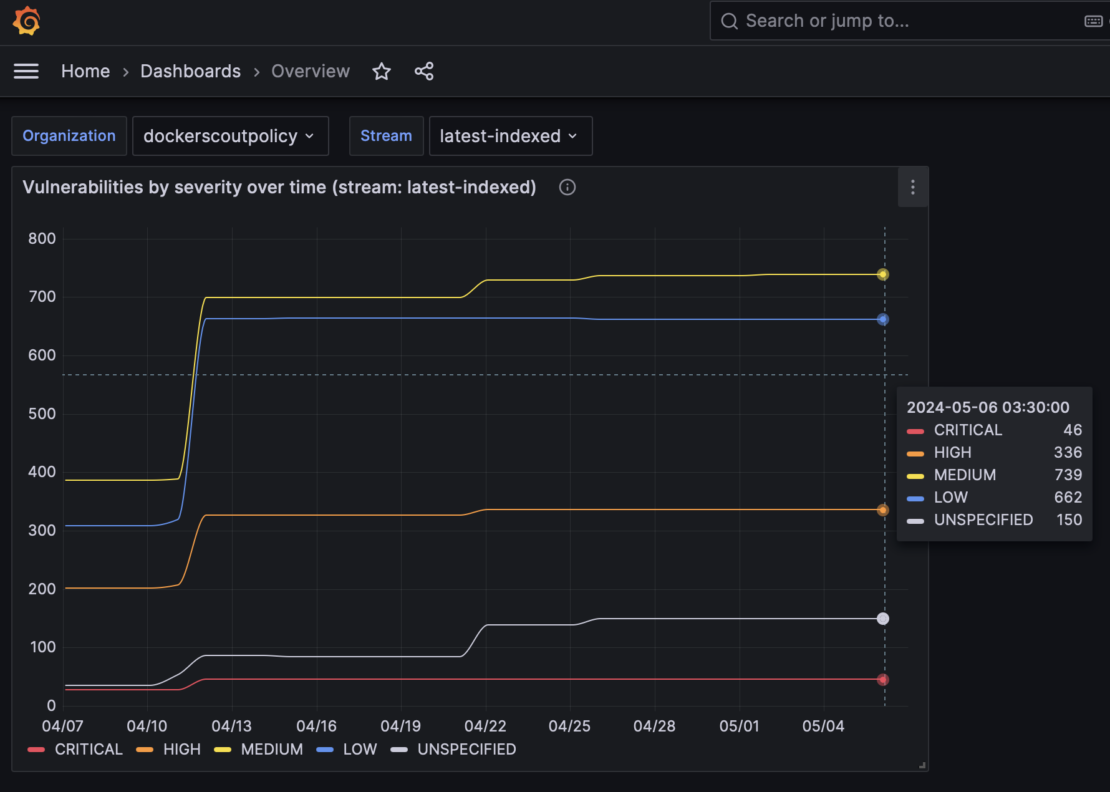
Figures 2 and 3 show two sample Grafana dashboards illustrating the vulnerability trends and policy compliance insights that Docker Scout can provide.

Figure 2 displays a dashboard that illustrates the compliance posture for each policy configured within a Docker Scout organization. This visualization shows the proportion of images in a stream that complies with the defined policies. At the top of the dashboard, you can see the current compliance rate for each policy, while the bottom section shows compliance trends over the past 30 days.
Figure 3 shows a second Grafana dashboard illustrating the number of vulnerabilities by severity over time within a given stream. In this example, you can see notable spikes across all vulnerabilities, indicating the need for deeper investigation and prioritizing remediation.

Conclusion
Docker Scout metrics exporter is designed to help security engineers improve containerized application security posture in an operationally efficient way. To get started, follow the instructions in the documentation. The instructions will get you up and running with the current public release of metrics exporter.
Our product team is always open to feedback on social channels such as X and Slack and is looking for ways to evolve the product to align with our customers’ use cases.
Learn more
- Visit the Docker Scout product page.
- Looking to get up and running? Use our Docker Scout quickstart guide.
- Have questions? The Docker community is here to help.
- New to Docker? Get started.
- Subscribe to the Docker Newsletter.
