Analytics for Publishers on Docker Hub
How does Docker Hub’s analytics feature work?
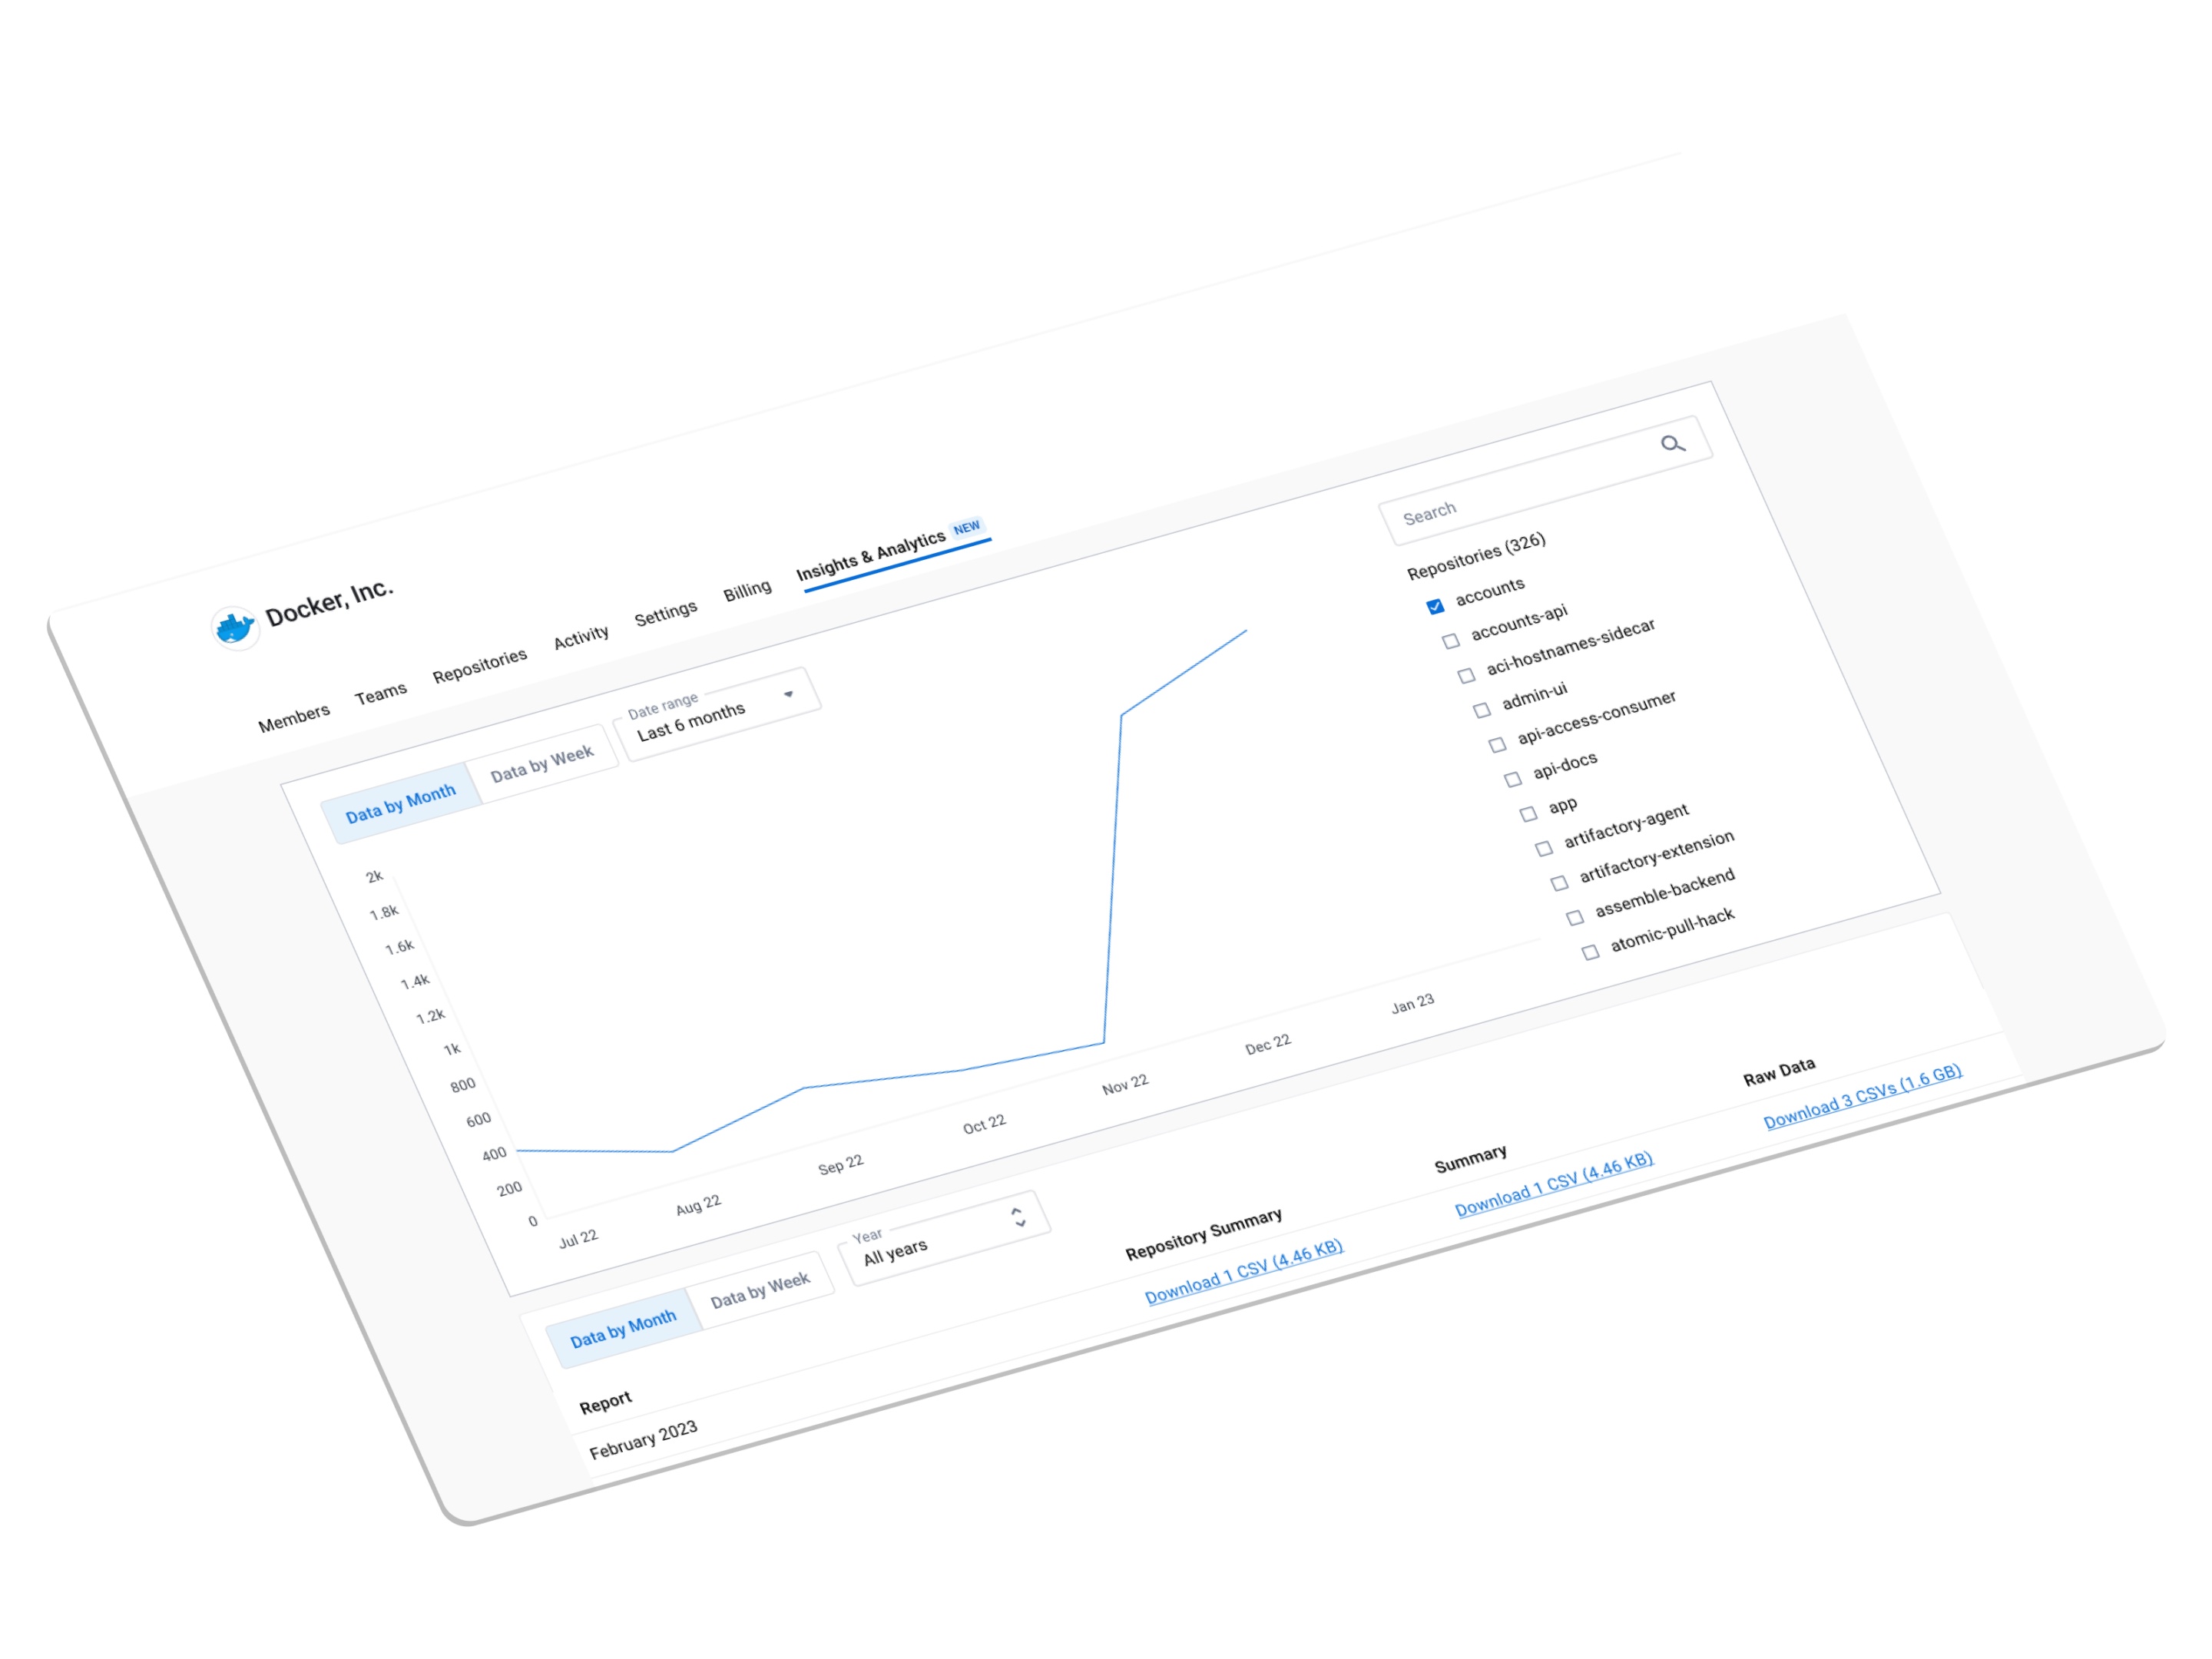
The analytics feature on Docker Hub offers a robust API and dashboard for in-depth product insights, to help you understand your distribution, identify usage patterns, and grow your business.
Docker Hub’s analytics feature is built on a custom algorithm that helps differentiates between automated ‘version checks’ and genuine user downloads by analyzing API call sequences and timings. This approach provides deeper insight into user behavior.
The API allows you to access raw and summarized data reports, available weekly and monthly, as downloadable GZipped CSV files.
Analytics are available for:
- Understanding information on content pulls, like timestamps, geographical distribution, or user agents involved (docker, containerd)
- Identifying version adoption trends (e.g., 40% user migration to a new tag release)
- Classifying domains for image pulls (cloud providers, etc.)

Get Started Now with a Free Sample Data Set
If you would like to review a sample data set for your namespace, fill out the form below.